Chapter 2 Theory
2.1 Atomic Scattering Factor
The elastic scattering of x-rays from an atom is described in terms of the atomic scattering factor, defined as the ratio of the radiation amplitude scattered by the atom to that by a free electron, in the form
In Eq. (2.1), ![]() and
and ![]() are the real and imaginary
part of the anomalous dispersion terms which account for the absorption
of x-ray by electrons bound in an atom. The anomalous scattering effect
is of interest for applications such as absorption and scattering experiments
and phase determination of crystal structures, and is very important for
RXR measurements. The
are the real and imaginary
part of the anomalous dispersion terms which account for the absorption
of x-ray by electrons bound in an atom. The anomalous scattering effect
is of interest for applications such as absorption and scattering experiments
and phase determination of crystal structures, and is very important for
RXR measurements. The ![]() term
represents in-phase scattering and the
term
represents in-phase scattering and the ![]() term represents scattering shifted by 90°
in phase. As for many types of dispersion phenomena
term represents scattering shifted by 90°
in phase. As for many types of dispersion phenomena ![]() and
and ![]() are linked by the Kramer-Kronig
relation,
are linked by the Kramer-Kronig
relation,
 (2.4)
(2.4)The anomalous scattering factors can be calculated using
the Cromer-Liberman method. A FORTRAN program based on this method is used
to calculate ![]() and
and ![]() in this thesis. Fig. 2.1 shows the calculated curves of
in this thesis. Fig. 2.1 shows the calculated curves of ![]() and
and ![]() for Ni and Fe around
their K-edges. The anomalous scattering factors can also be obtained experimentally,
for example, by measuring a set of Bragg reflections from a crystal of
known structure that contains a suitable heavy atom.
for Ni and Fe around
their K-edges. The anomalous scattering factors can also be obtained experimentally,
for example, by measuring a set of Bragg reflections from a crystal of
known structure that contains a suitable heavy atom.

Fig. 2.1 Calculated linear absorption and the anomalous
scattering factor for Ni and Fe. The K-edge of Ni is at 8333 eV and Fe
is at 7112 eV.
Even though the wave length l
is comparable to atomic dimensions, specular reflectivity of x-ray can
be described by the Fresnel theory of classical optics.20,25
For each material, a complex dielectric constant ![]() can be defined:
can be defined:
 (2.6)
(2.6) (2.7)
(2.7) (2.8)
(2.8) (2.9)
(2.9)
Fig. 2.2 Composition dependence of the electron density
and linear absorption at different x-ray energies.
2.2 Dynamic Theory of X-ray Reflectivity
In this thesis, the concept of dynamic theory refers to the methods of solving the reflectivity problem for a layered structure in an exact way, such as the matrix formalism by Vidal and Vincent, and the recursion scheme by Parratt.20 Kinematical theory, on the other hand, is an approximation that neglect the multiple scattering and is valid only for the reflectivity at an incident angle larger than about twice the critical angle of total reflection. The Born approximation and the so called " single-scattering dynamical theory " are examples of kinematical theory. In solving the reflectivity problem for multilayer structures, the dynamical diffraction theory for perfect crystal developed by Darwin and Ewald are used by some authors. This method can be employed to calculate the reflected intensity about the Bragg peaks only and will not be discussed here.
Let's consider a layered structure with two rough interfaces at z1 and z2 (see Fig. 2.3). The real position of the interfaces can be described by a two dimensional surface function Zi(x,y) which satisfies:
 (2.10)
Fig. 2.3 Schematic representation of x-ray reflectivity
from a two-interface structure.
The specular components of the x-ray waves in the three media e1, e2 and e3 can be represented by:
 (2.11)
For ideal interfaces (s= 0), the continuity of the electric field and its first derivative across the interface gives for s polarization (E perpendicular to the incident plane),
 (2.14)
 (2.15)
For a rough interface, when the roughness sis less than the thickness of the layer, a matrix form including the nonideal interface effects can be given by applying Green's theorem to the interface:38
For a two interface structure, from (2.16), one can get:
 (2.22)
![]()
From the recursion scheme we can derive a formula which is especially useful in calculating the reflectivity from a very thick multilayer with a constant repetition period. By "very thick " we mean the total thickness of the multilayer exceeds the sensitive depth of x-ray reflectivity measurements, which is mainly limited by the angular resolution of the experiment setup. For example, if the angular resolution is 0.01° , the sensitive depth estimated by the Bragg law is about 3000 Å. In this case, the rN and rN-2 defined in (2.22) are equal and the substrate information is not relevant, by using the recursion twice and set rN = rN-2 , we will have:
 (2.25)
2.3 Kinematic Theory of X-ray Reflectivity
In the standard kinematic theory of x-ray reflectivity, Born Approximation, the reflected intensity is given by:

Fig. 2.4 Calculated reflectivity curves from a multilayer with six bi-layer periods. The solid line is for the dynamical calculation (Matrix formalism), the dot line for the single-scattering theory and the dash-dot line for Born approximation.
The importance of the Born approximation is that it relates the measured intensity to the Fourier transform of the density profile derivative. From (2.26) the autocorrelation function (ACF) , or Patterson function can be derived by merely taking a Fourier transform:
 (2.27)
There are several forms of pseudokinematical theories that make corrections over the standard Born approximation. These corrections usually involve two steps. First the prefactor in (2.26) is replaced with the Fresnel reflectivity of the substrate, thus avoid the divergence at small angles. The next step is to replace the vacuum path length Qzz in the phase factor of (2.26) with a refraction-corrected path length. The most straight forward and effective approach in doing this is given by the "single-scattering dynamical theory",45
 (2.29)
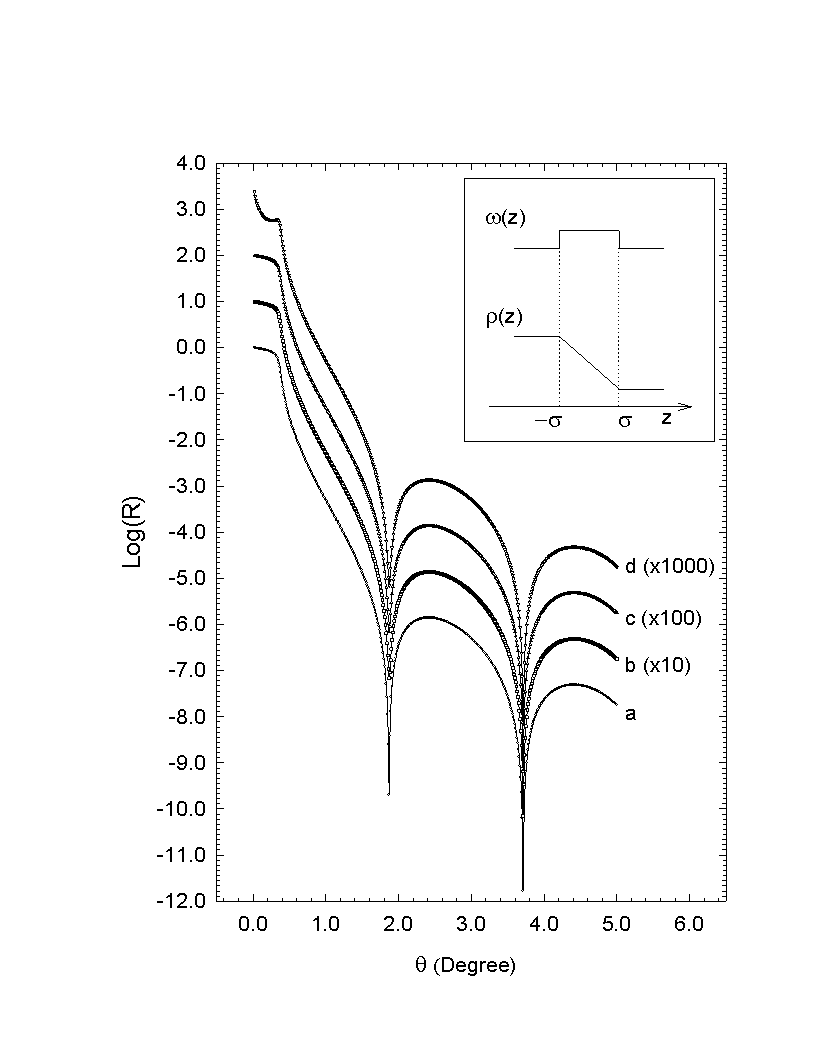
Fig. 2.5 Reflectivity simulated from a linear density
profile. (a) Form factor method (2.32), (b) Multi-step function (thin density
box method), (c) exact solution, use Hankel functions as wave functions
and (d) single scattering approximation (2.30). The interface model is
shown in the inlet. The half width s is 12 angstrom.
2.4 Interface Model
In this section we will discuss different interface models and methods for calculating the reflectivity from these model interfaces.
Consider a single interface, the reflectivity coefficient
r will be given by (2.23):
 (2.32)
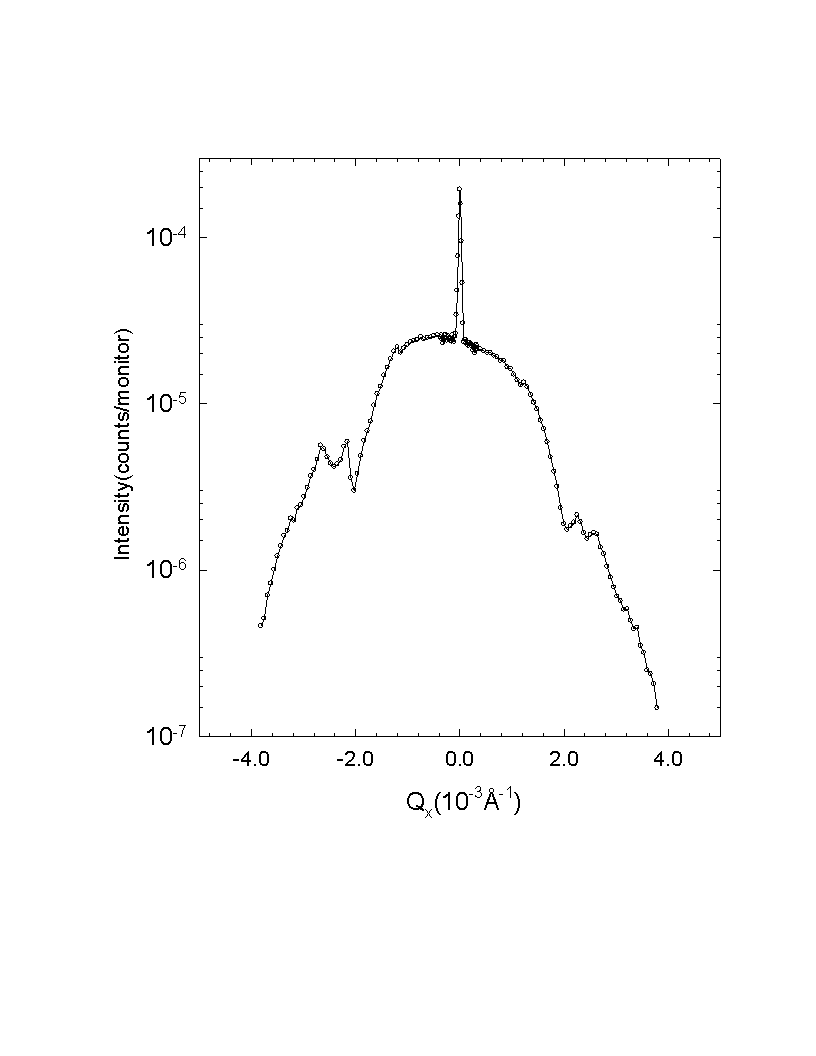
Fig. 2.6 Transverse scan of diffuse and specular x-ray
scattering for a Ni/W multi-layer across a superlattice Bragg peak. The
narrow central potion represents the true specular folded with instrumental
resolution.
To calculate the x-ray specular reflectivity from a rough
interface, one has to assume a probability density function for the interface
position in the direction of the surface normal. this often leads to a
Gaussian distribution (2.19). For the reflectivity in the low Qz region,
or in the case of a small interfacial roughness, the Gaussian distribution
can reasonably account for almost any interface form since the higher cumulant
terms are negligible. However, in the region of relatively higher Qz, and/or
for an interface with large roughness or width, the Gaussian distribution
is not necessarily the right choice. Eq. (2.18) and (2.32) can be used
with other forms of probability density functions. Some examples are given
in following paragraphs.
Constant distribution
 (2.34)
![]() (2.35)
(2.35)
Lorentz distribution
![]() (2.37)
(2.37)
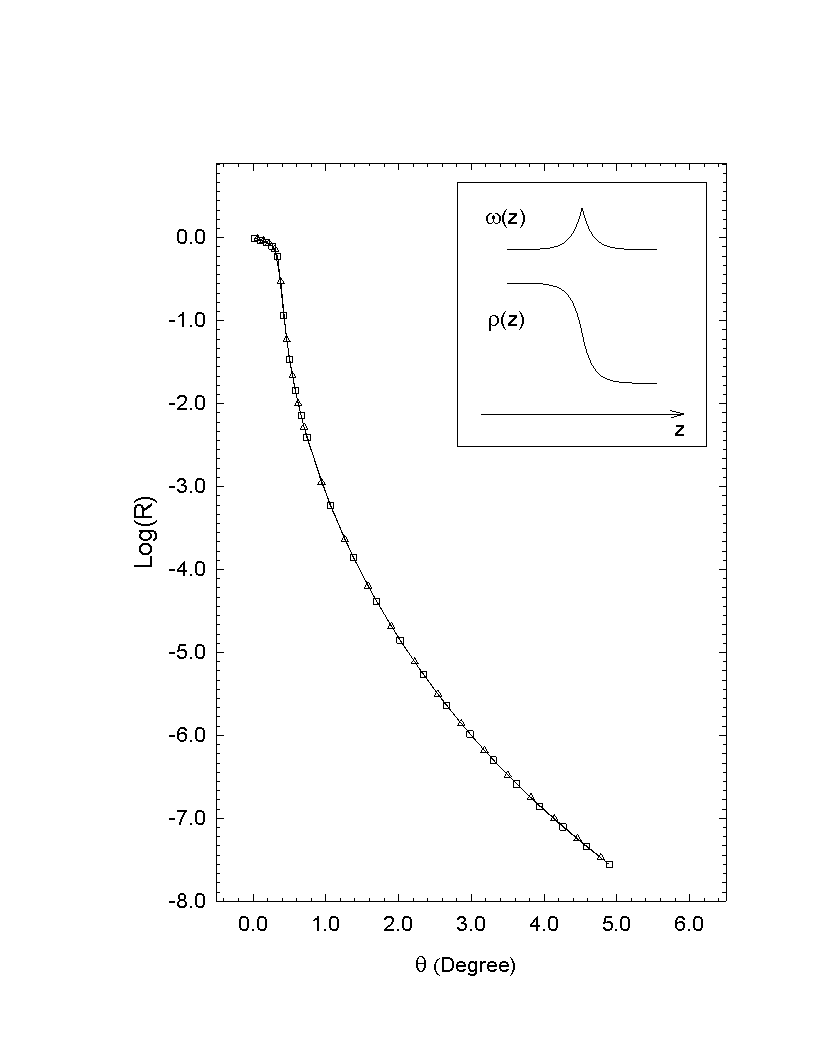
Fig. 2.7 Calculated reflectivity from a Lorentz distribution (2.36) with s = 4.0 Angstrom. The squares are for the Form factor method and the triangles for thin density box method. The interface model is shown in the inlet.
Cosine distribution
 (2.38)
![]() (2.39)
(2.39)
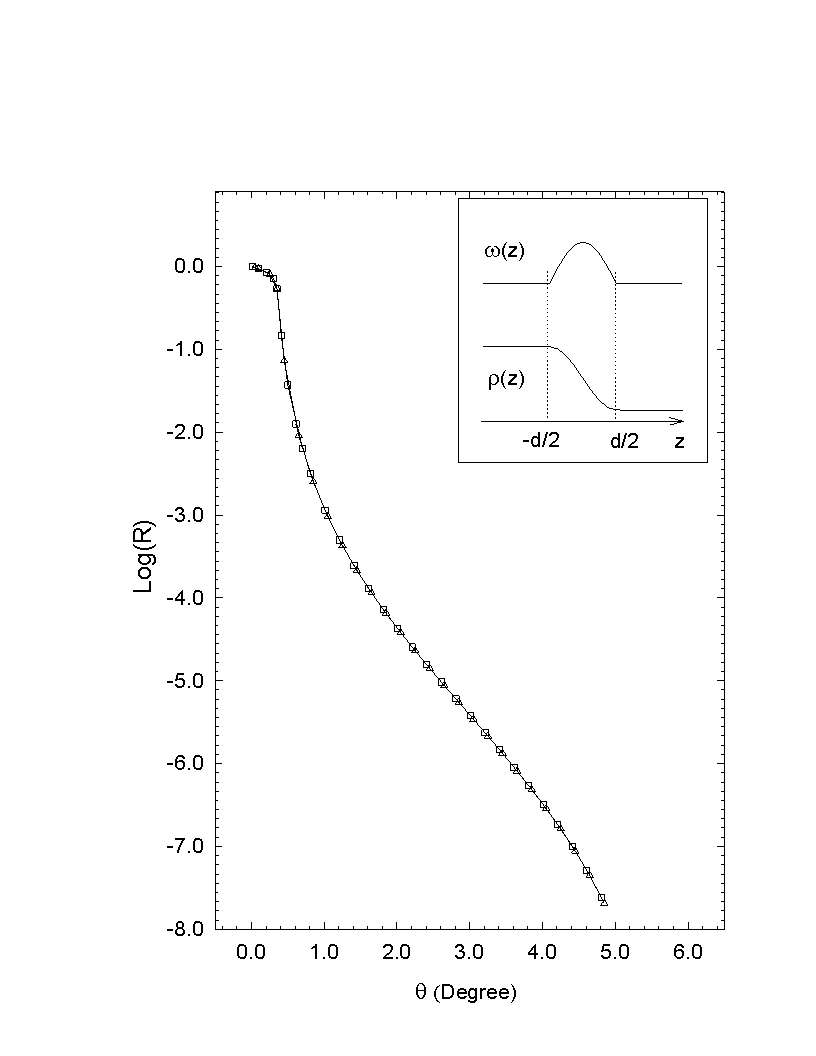
Fig. 2.8 Calculated reflectivity from a Cosine distribution
(2.38) with d = 8.0 Angstrom. The squares are for the Form factor method
and the triangles for the thin density box method. The interface model
is shown in the inlet.
The above examples demonstrated the flexibility of the form factor methods. They are also numerical proofs of the equivalence between the rough interface model and the graded density model in specular reflectivity calculation. In the analysis of x-ray reflectivity data, one can also assume other forms of distribution functions, and calculated the corresponding form factor. The effects of different interface models usually show up only at high Qz values of the reflectivity curves. (Fig. 2.9)
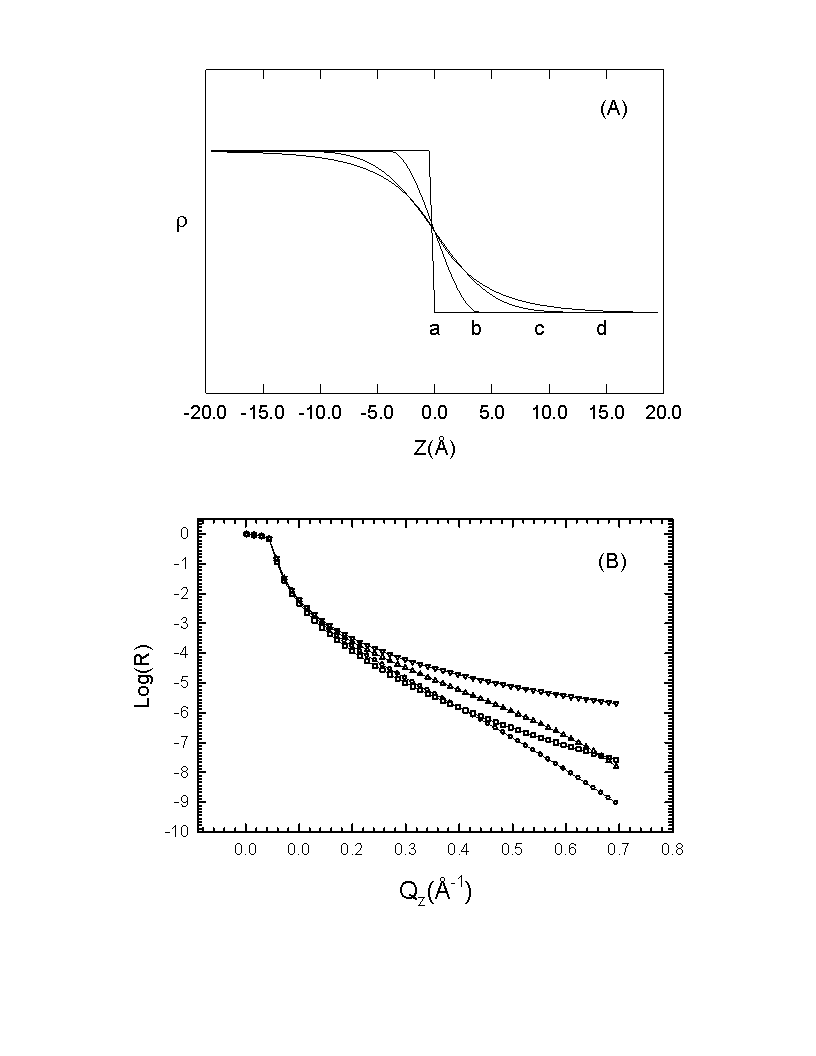
Fig. 2.9 Comparison of reflectivity curves calculated
with different interface model. (A) shows the density profiles of the ideal
sharp interface (a), Cosine distribution (b), Gaussian distribution (c)
and the Lorentz distribution (d). (B) shows the reflectivity curves for
a (![]() ), b (D
), c (¡ ) and d (¨
).
), b (D
), c (¡ ) and d (¨
).
The form factor method is based on a perturbation to the plane wave solution. The reflectivity calculated with this method is questionable when the thickness of the layer is less than or equal to the surface roughness of the interface.38 When there is a large in depth spatial variation region across the interface, one has to assume a stratified medium and solve the one dimensional Helmholtz equation for the electromagnetic fields.28
One way to solve (2.40) is to use a multi-step function (thin density boxes) to approach the real (in plane averaged) electron density. In each thin box, the plane wave solution is assumed and then (2.22) can be used to calculated the reflectivity. On the other hand, it is well known that (2.40) can be solved analytically for a linear density profile. In next section we will give a formalism for solving (2.40) by approaching the density profile with a series of straight line segments. This method has been used to analyze the reflectivity data from the Ni/Fe alloy thin film sample, which will be discussed in detail in Chapter 4.
2.5 The solution of the X-ray Reflectivity Problem for a Linear Stratified Media
Define: (see Fig. 2.10)
 (2.42)
For z > z3:
 (2.44)
 (2.46)
 (2.47)
At z = z3, we apply the boundary conditions:
 (2.48)
 (2.50)
Applying the boundary conditions at z = z2, we have:
 (2.52)
Boundary conditions at z = z1:
 (2.54)
Combining (2.50), (2.52) and (2.54), we have:
There are two ways of characterizing an interface. One
way is to assume a zigzag but sharp boundary between two media (see Fig.
2.11A). The reflectivity from this kind of interface is given by (2.21)
provided that ![]() . The other
way is to assume a smooth but extended boundary and solve the Helmholtz
equation (2.40). (see Fig. 2.11B) .It is well accepted that the Gaussian
probability density function of the boundary position which leads to the
Gaussian factor in (2.21) can be used to derive an effective refraction
index profile. If this index function (or dielectric constant function)
is inserted into (2.40), one get the same reflectivity by solving the differential
equation. So it seems that the two way of characterizing the interfaces
are equivalent and one can not tell the difference just from the specular
reflectivity. However, these two kinds of interfaces are not completely
equivalent because: (1) in case A , there is a limit
. The other
way is to assume a smooth but extended boundary and solve the Helmholtz
equation (2.40). (see Fig. 2.11B) .It is well accepted that the Gaussian
probability density function of the boundary position which leads to the
Gaussian factor in (2.21) can be used to derive an effective refraction
index profile. If this index function (or dielectric constant function)
is inserted into (2.40), one get the same reflectivity by solving the differential
equation. So it seems that the two way of characterizing the interfaces
are equivalent and one can not tell the difference just from the specular
reflectivity. However, these two kinds of interfaces are not completely
equivalent because: (1) in case A , there is a limit ![]() while in case B there is no limitation in the width of the interface. When
there is a large in depth spatial variation region across the interface,
it can not be described by a simple Gaussian factor. (2) In case A part
of the energy flux goes into diffused scattering while in case B all the
energy flux goes either into specular reflection or refracted beam.
while in case B there is no limitation in the width of the interface. When
there is a large in depth spatial variation region across the interface,
it can not be described by a simple Gaussian factor. (2) In case A part
of the energy flux goes into diffused scattering while in case B all the
energy flux goes either into specular reflection or refracted beam.
We will try to demonstrate that the two ways (A and B) can be combined together to give a more complete description of an interface. (see Fig. 2.11C). We will prove that for a rough extended interface, the matrix is given by adding the same factor to the matrix elements of the smooth extended interface. The refraction index profile along z can be of any form. However, we assume that the interface has the same local, gradual surface profile, but that its boundary varies in the x-y plane as some function h(x,y).
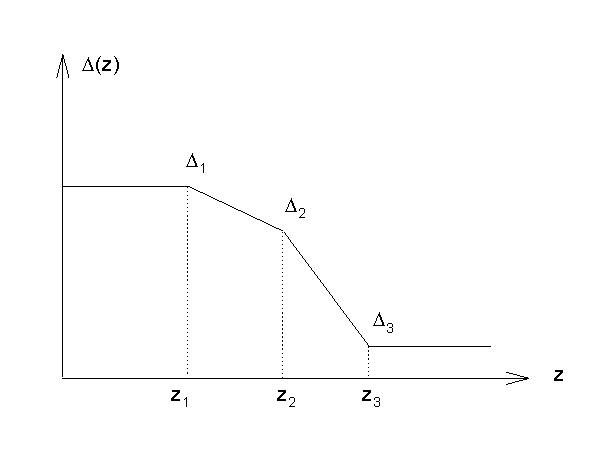
Fig. 2.10 Linear segments description of a model interface.
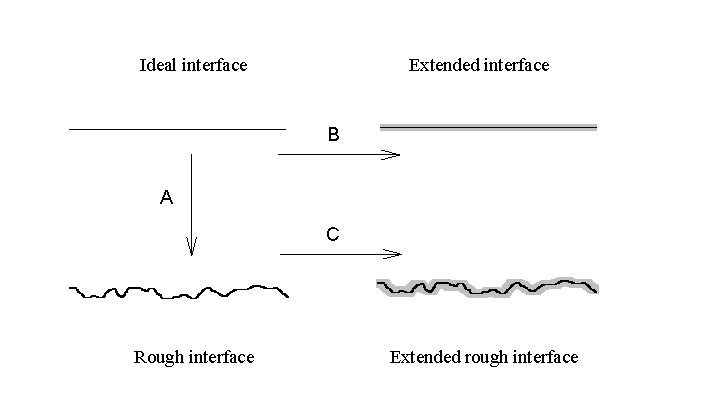
Fig. 2.11 Characterization of interfaces.
![]()
For an ideal interface at z = z0, the electric field on the two sides can be written as:
 (2.58)
For a smooth extended interface with z1-z2=d, we have:
 (2.59)
 (2.60)
 (2.61)
We then get:
 (2.62)
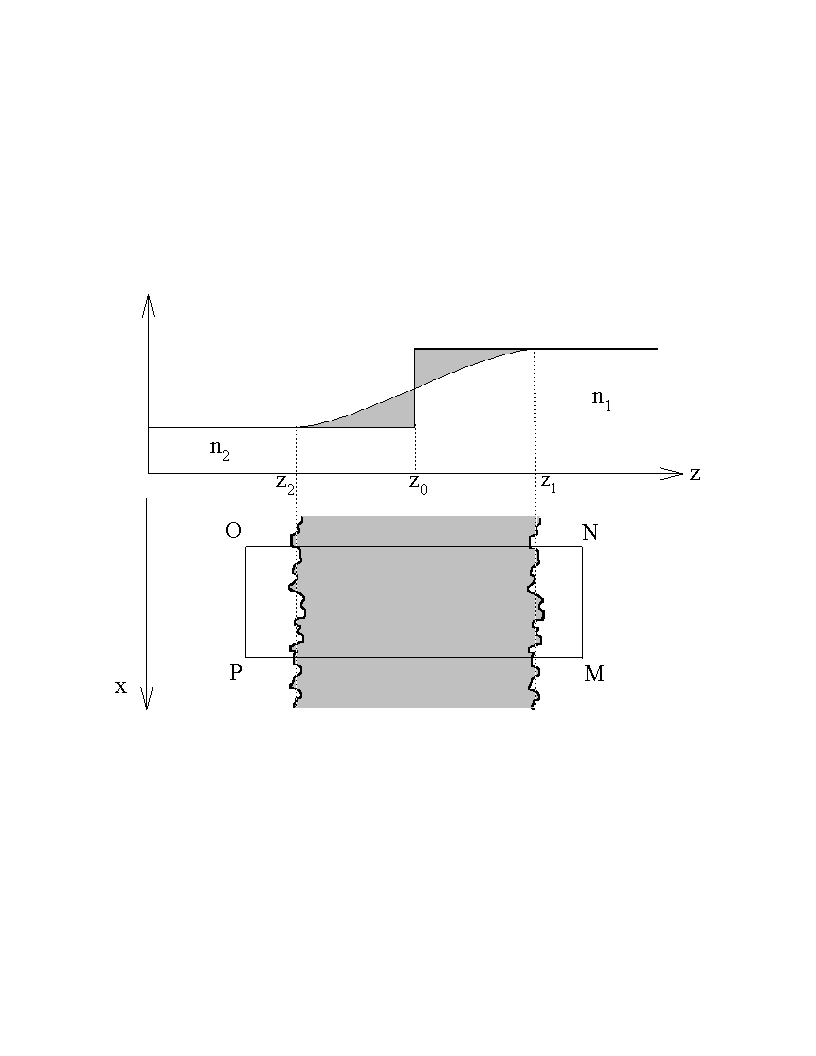
Fig. 2.12 Schematic representation of the extended rough
interface and the contour for Green's function.
Where ![]() is a gradual function of z between [z2, z1] and
is a gradual function of z between [z2, z1] and ![]() for z < z0 and
for z < z0 and ![]() for
z > z0 . And:
for
z > z0 . And:
 (2.63)
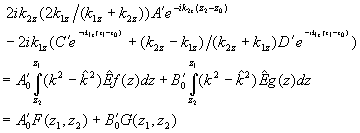 (2.65)
 (2.66)
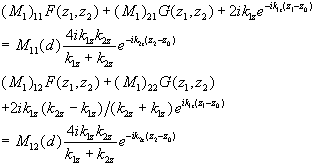 (2.67)
 (2.68)
region [z2, z1] and now z2, z1 are functions of x. Assume ![]() are related to
are related to ![]() by:
by:
 (2.70)
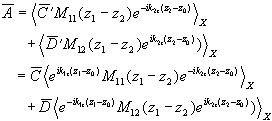 (2.71)
 (2.72)
In a similar way we can get:
 (2.75)